Decoding the Neural Code
Before we can correct vision, we must understand how the brain processes it. Our research begins at the foundational level: analyzing how visual pathways interpret motion and contrast to distinguish between optical deficits and neurological processing issues.
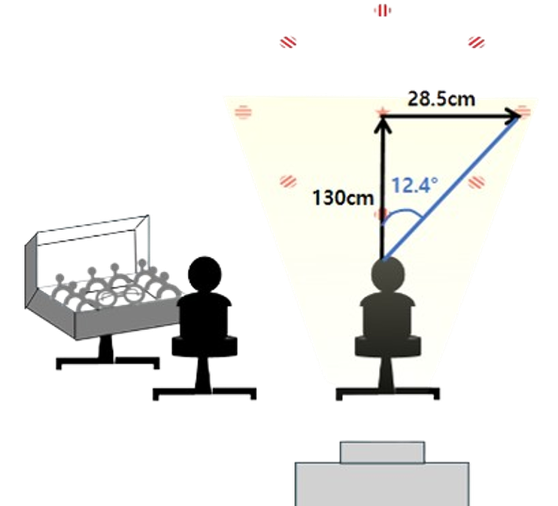
Motion Contrast Sensitivity
Contrast sensitivity measures the visual system's ability to distinguish objects from their background, a critical indicator of functional vision beyond standard acuity. We utilize Gabor patches—sinusoidal gratings modulated by a Gaussian envelope—to precisely probe spatial and temporal summation mechanisms. By varying the size and duration of these stimuli, we can map the receptive field properties of visual neurons and isolate deficits in specific neural channels.

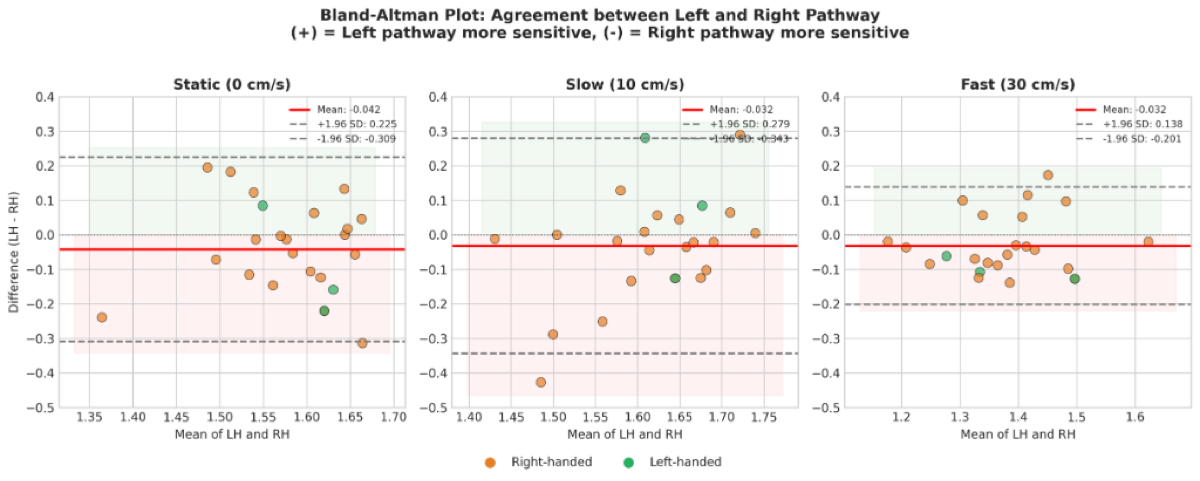
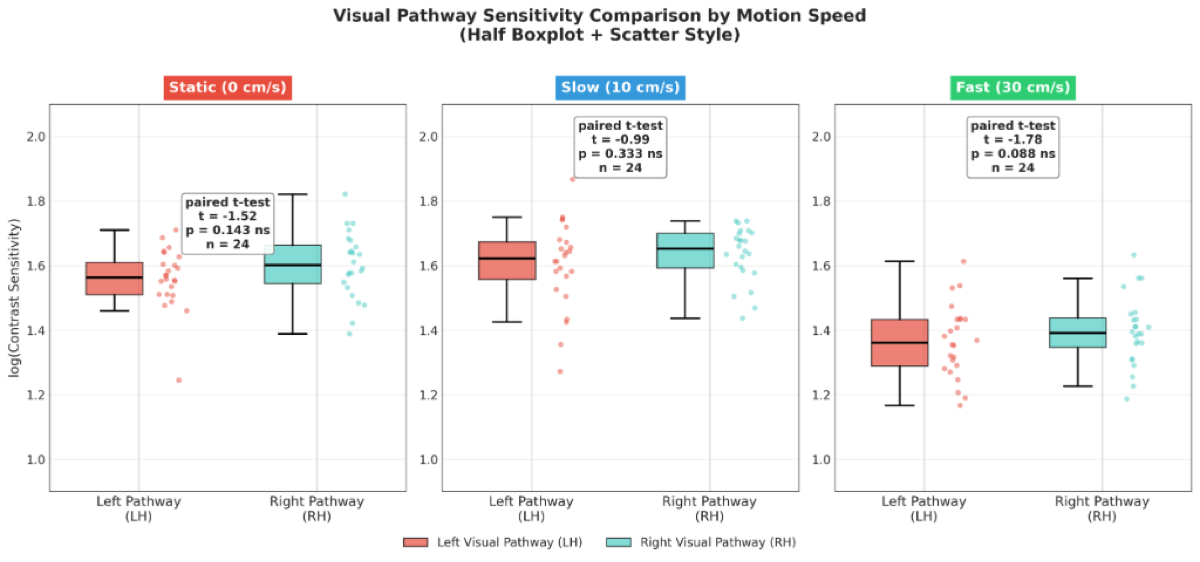
Key Findings: The sensitivity threshold analysis reveals distinct functional baselines across age groups, with the boxplot demonstrating significant variance in the older demographic. This data establishes a quantitative standard for detecting subtle neural degradation before structural damage becomes visible.
Mysteries of the Eye's 6 Interfaces: Refraction
Myopia progression is closely related to morphological changes in the peripheral retina. We use precise geometric optical modeling and chromatic aberration principles to quantitatively determine the impact of myopia on retinal geometry.
Study 1: Precise Geometrical Optics Modeling & Simulation
Research Overview
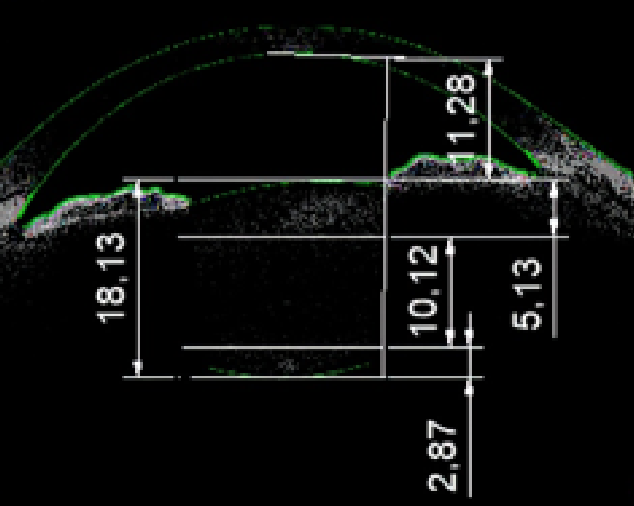
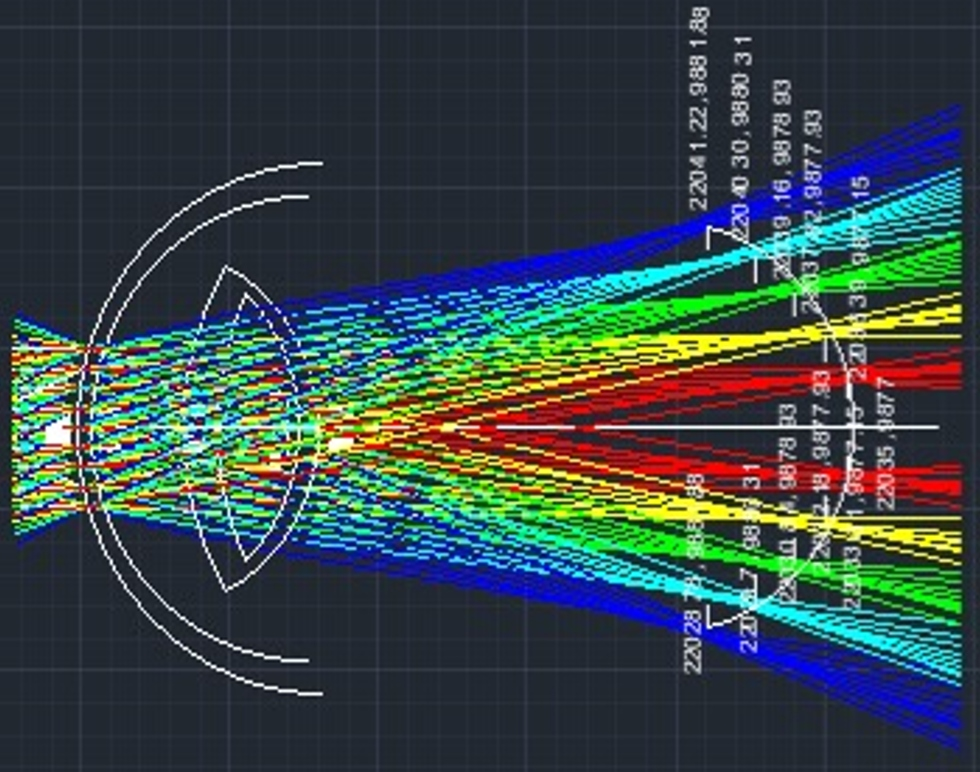
Since 2014, we have applied a proprietary calculation algorithm to precisely calculate all angles of incidence and refraction at 6 refractive surfaces: anterior/posterior cornea, anterior/posterior lens cortex, and anterior/posterior lens nucleus.
Key Findings
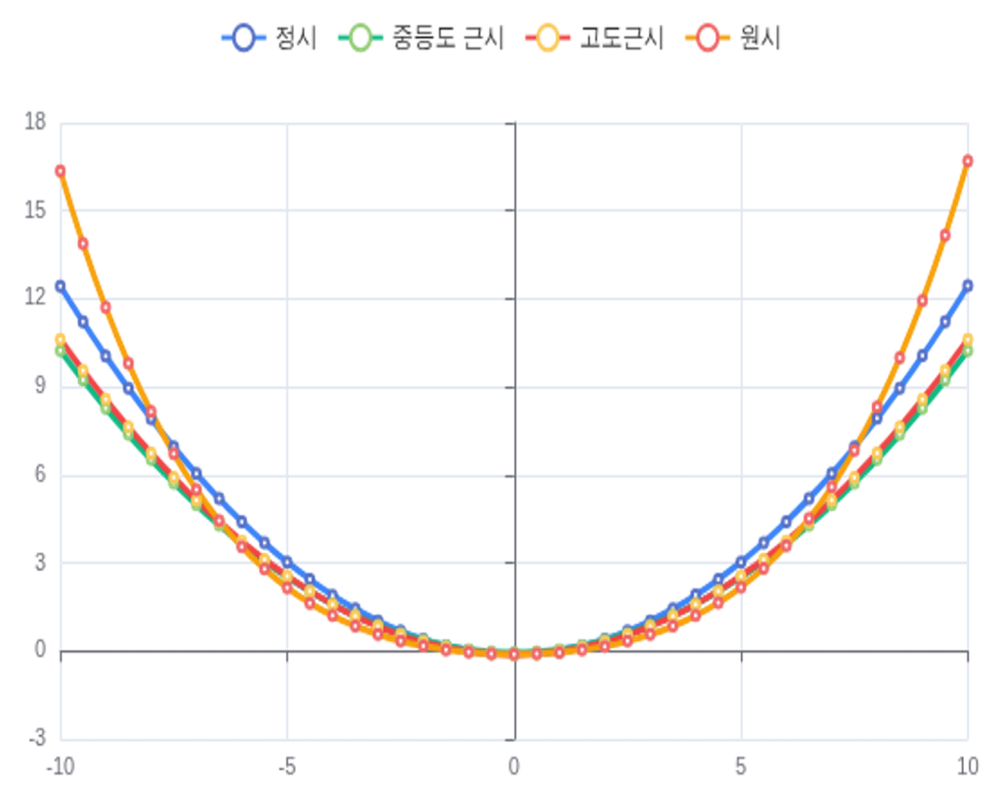
- Correlation Confirmed: A strong positive correlation (r=0.836) was confirmed between spherical equivalent refraction and retinal curvature radius.
- Asymmetric Expansion: The most distinct changes were observed in the Temporal and Inferior retina, suggesting asymmetric expansion during myopia progression.
Study 2: Chromatic Aberration-based Peripheral Refraction Measurement
Research Overview
To accurately measure the refractive state of the peripheral retina, we utilize the principle of Longitudinal Chromatic Aberration between Red and Green wavelengths.
- Step 1. Iso-clarity Calibration: Establish subjective iso-clarity baseline by measuring contrast sensitivity of 1cpd Red/Green patches in the central field.
- Step 2. Peripheral Stimulation: Randomly flicker Red/Green LED pairs arranged on concentric circles at 8°, 16°, and 32°.
- Step 3. Refraction Calculation: Inverse calculate the focal position on the retina by analyzing clarity response patterns.